

|
Back to |
| The Front Page |
| News & Features |

|
Toward universally comparable handicaps
|
|
|
By by Louis Nel Posted May 8, 2004
|
|
Which Croquet Association handicap in England corresponds to a 2.5 in New Zealand? Similar questions about Association Croquet handicaps of other member countries of the World Croquet Federation arise all the time. My basic task as WCF Handicapping Coordinator is to answer such questions in a systematic way. I have reached a point where the first batch of comparisons has become possible. In this article, I’d like to explain my approach and what lies ahead on the road to international handicap correspondence. And at the end of the article, I’ll invite you to assist in this effort by sending me your personal data from a self-administered “Standard Bisque Count” test.
I started out with naive optimism. Surely, I thought, the lowest handicap in each of the big croquet countries would be more or less equivalent. I hoped one could just go up in units of 0.5 from that common starting point to expand the correspondence. I was soon disillusioned. I considered percentiles and quickly recognized their futility for this purpose. My thoughts then turned to World Ranking Grades -- a measure of ability common to all countries. Surely that would link equivalent handicaps. I was not the first to expect that. Ian Plummer (Oxford Croquet Website) had already studied aspects of this. His plot of the Handicaps against World Ranking Grades of UK players revealed "a huge scatter of the data". He repeated this analysis for several other prominent countries, only to reveal a similar scatter in every case. The situation began to look quite chaotic.

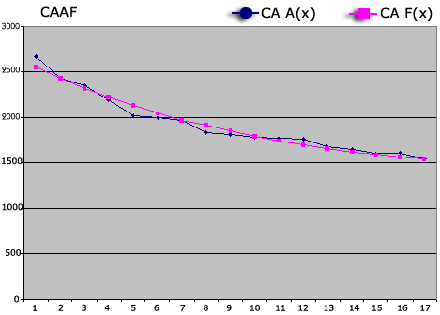
It occurred to me that this scatter might become manageable if one used only the average Grade corresponding to each handicap. For example, the average Grade of the 15 graded UK players with handicap 0.5 was 1971 and for the eight players with handicap 1.0 it was 1829 (2002 data). I plotted these averages for all handicaps, and the outlook began to look more cheerful: these averages seemed to outline a curve, however roughly. I did the same for other countries and I noticed a resemblance. They all reminded me of the exponential curves arising in the mathematical modeling of many real world phenomena. That was an encouraging breakthrough. I fitted an exponential curve (purple) to the crude curve formed by the averages (black) to get the following picture:
|
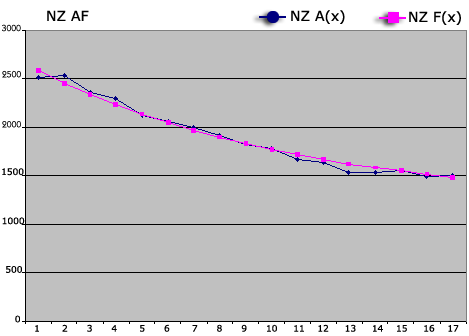
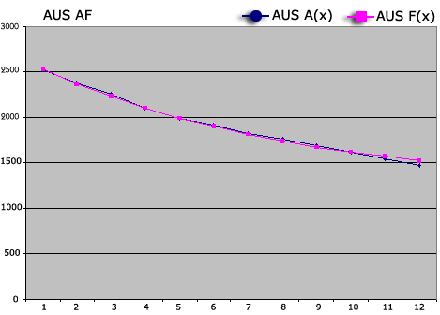
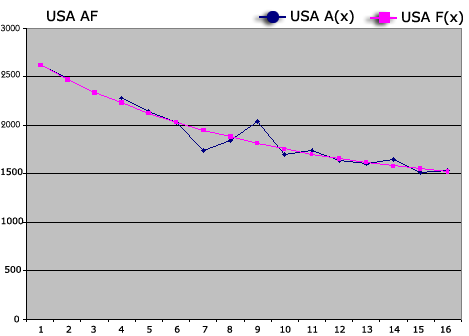
Note that in this chart as well as the ones to follow, the numbers on the horizontal axis denote handicap steps, not handicaps. Handicap step 1 represents the lowest handicap, step 2 the second lowest, and so on.
The CA [English Croquet Association] data (Graded players in 2002) was kindly provided by Ian Plummer. The handicap system of the CA is regularly updated from actual handicap play (automatic system) as well as from level play results.
Let us call the Grades arising from the exponential curve Fitted Grades and use the following notation:
x denotes the handicap step
A(x) denotes the Average Grade at step x (black dots in the chart).
F(x) denotes the Fitted Grade at step x (purple dots in the chart).
It should be noted that the fitted smooth curve is not an arbitrary choice. It is derived from the Average Grades A(x) by a certain method that gives a Best Fitting Curve. The general reader need not be concerned with a detailed description of the method. To scientific types it can be explained briefly as follows. The smooth curve is an exponential curve of the special form
y = a + b exp(-cx)
where a, b and c are numerical constants. These constants are chosen so as to minimize the Root Mean Square Difference A(x) - F(x) over the relevant handicap steps x. The constants then define the Best Fitting Curve and its value at x gives the Fitted Grade F(x) = a + b exp(-cx).
The Best Fitting Curve is, of course, an idealized representation. The scatter reported in Ian Plummer's study is a healthy reminder that the real data are subject to the usual randomness that attend all sports results, always troublesome in the small samples we have to work with in the croquet world. See also my article “Randomness and Ranking” (Association Croquet North America,). However, there is an orderliness lurking amid all that randomness. The Average Grades A(x) begin to bring that orderliness into focus. The Best Fitting Curve has the effect of smoothing over the "experimental errors" inherent in the real data and brings the underlying orderliness still more sharply into focus. In a large sample (involving thousands of players with the same handicap) one could expect the Average Grades to resemble the Fitted Grades F(x) closely, even though the mentioned scatter would remain.
Such Best Fitting Curves were constructed for other countries too. Take a look.
|
The New Zealand handicaps used came from their 2002/3 yearbook. Their handicaps, like that of the CA, get updated from actual handicap play as well as level play. They are now also on an automatic system.
|
The Australia handicap data came from their website, reflecting their national system (not to be confused with the separate systems of their states). They use World Ranking Grades for determination of these handicaps. So it is no wonder that their Best Fitting Curve hugs the real data so closely. That closeness is excellent where the system is used for ranking (a questionable practice) but provides no guarantee about giving the appropriate number of bisques for handicapped games (we will return to this aspect).
|
The USA handicaps came from their website (again, only those of Graded players were used). These handicaps, determined subjectively by a committee, are seldom if ever used for handicap play.
The WCF scale can be a universal yardstick for all countries
Now, let us get to the point. The Fitted Grades provide a means to compare handicaps of Graded players -- for two given countries we could just match up their Fitted Grades. However, 25 member countries would require 300 tables if two at a time are compared. This proliferation is avoided by having a theoretical handicap scale - the WCF [World Croquet Federation] scale - to serve as a universal yardstick. The WCF scale is defined by a selection of Grades F(x) that perform the role of Fitted Grades for it. They are specified in the Comparison Table below, at least for the low handicaps shown. The chart to follow shows how the WCF Fitted Grades relate to those of the CA and New Zealand. All of this will be updated from time to time.
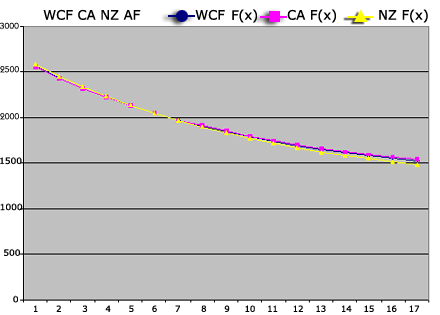
|
We are now in a position to establish global handicap correspondence – at least for low handicaps. For such a handicap of a given country, we find a matching one on the WCF scale by matching up the Fitted Grades as best we can. Two low handicaps coming from different countries correspond to each other if they correspond to the same handicap on the WCF scale. The following table illustrates: handicaps on the same horizontal line correspond to each other.
| National Handicap Comparison Table | |||||||||
|---|---|---|---|---|---|---|---|---|---|
| WCF | CA | NZ | Aus | USA | |||||
| Hcap | F(x) | Hcap | F(x) | Hcap | F(x) | Hcap | F(x) | Hcap | F(x) |
| -3 | 2692 | -3 | 2685 | -2.0 | 2615 | ||||
| -2.5 | 2555 | -2.5 | 2549 | -4 | 2579 | 2 | 2524 | ||
| -2 | 2432 | -2 | 2427 | -3.5 | 2451 | -1.5 | 2470 | ||
| -1.5 | 2320 | -1.5 | 2316 | -3 | 2334 | 2.5 | 2365 | -1.0 | 2341 |
| -1 | 2219 | -1 | 2217 | -2.5 | 2228 | 3 | 2224 | -0.5 | 2226 |
| -0.5 | 2128 | -0.5 | 2127 | -2 | 2132 | 3.5 | 2100 | 0.0 | 2123 |
| 0 | 2045 | 0 | 2045 | -1.5 | 2045 | 0.5 | 2031 | ||
| 0.5 | 1970 | 0.5 | 1972 | -1 | 1966 | 4 | 1992 | 1.0 | 1950 |
| 1 | 1903 | 1 | 1906 | -0.5 | 1894 | 4.5 | 1896 | 1.5 | 1877 |
| 1.5 | 1842 | 1.5 | 1846 | 0 | 1828 | 5 | 1811 | 2.0 | 1812 |
| 2 | 1787 | 2 | 1792 | 0.5 | 1769 | ||||
| 2.5 | 1737 | 2.5 | 1743 | 1 | 1715 | 5.5 | 1737 | 2.5 | 1754 |
| 3 | 1692 | 3 | 1699 | 6 | 1671 | 3.0 | 1703 | ||
| 3.5 | 1651 | 3.5 | 1659 | 1.5 | 1666 | 3.5 | 1657 | ||
| 4 | 1614 | 4 | 1623 | 2 | 1621 | 6.5 | 1614 | 4.0 | 1616 |
| 4.5 | 1581 | 4.5 | 1591 | 2.5 | 1581 | 7 | 1563 | 4.5 | 1580 |
| 5 | 1551 | 5 | 1562 | 3 | 1544 | 5.0 | 1547 | ||
| 6 | 1524 | 6 | 1535 | 3.5 | 1511 | 7.5 | 1518 | 6.0 | 1518 |
This table still needs to be expanded vertically (to accommodate higher handicaps) and horizontally (to accommodate other member countries that have handicap systems). I already have system information for many countries but I still lack a lot of data. When more complete listings are possible, I foresee an official listing on the WCF website, updated from time to time.
What can we learn from the Comparison Table?
It was pleasing to discover how closely the CA and New Zealand systems resemble each other. This is remarkable if one considers that they evolved independently a great distance apart.
The Comparison Table has many gaps in the Australia column. These gaps reflect the steeper slope of the Best Fitting Curve for Australia compared to CA and New Zealand. The practical implication is that a handicap game between two players would, under the Australia handicaps, typically involve fewer bisques than it would under the CA or NZ system. Consider, for example, a handicapped game between two players with abilities 2520 and 1520 on the Grade scale. The Australia system would prescribe 5.5 bisques (5.5 = 7.5 – 2.0), the NZ system would prescribe 7.5 bisques and the CA system 8.5. Since the Australia handicap system is hardly ever actually used for handicap play, any bisque discrepancies will remain unnoticed in practice.
The above table shows that when the Grades drop to near 1500, the Grade gap between successive handicaps shrinks to about 30 -- a small interval. In level play, the winning probability associated with having 30 more Grade points is about 53.5% (see my article “Winning probabilities associated with Grade differences” in Association Croquet North America).
It is hard to recognize that one player is stronger than another when the winning probability falls below 60%, i.e. if the corresponding Grade point difference falls below 85 points.
So the question arises: should the bisque increments not become larger more rapidly as the handicaps become higher? At present the increments start at 0.5 at the low end, stays that way for about 16 handicap steps before becoming 1.0 and then typically has only one further increase, namely to 2.0. Should it not become 1.0 a little sooner, become 2.0 a little sooner, and then become 3.0 or higher near the high end? This calls for further study.
Does your country actually need a handicap system?
A country needs a handicap system only if it regularly holds handicap play tournaments. It certainly does not need one for ranking purposes. Handicap scales are not designed with ranking in mind. The top end, where the players are most competitive and where most data are typically available, happens to be where the handicap scale as ranking tool is at its bluntest. For example, on the CA handicap scale the increment from -2.5 to -2 (the top end) spans about 120 Grade points (winning probability 63.5). So it can fail to distinguish between two players even when they are over a hundred Grade points apart in ability. As the ability levels decrease, the handicap scale gradually becomes more distinguishing. For example, the increment from CA handicap 5 to 6 spans only 27 Grade points (winning probability 53%). For still higher handicaps it becomes even smaller than that. So the handicap scale is at its worst where sharp resolution is most needed and has its sharpest resolution where that is least needed.
Players could be ranked on the World Ranking scale even if they don’t appear there – they just need to be compared with players who do appear. For example if a player is judged to have ability between those of players with known Grades 1769 and 1521, then it is reasonable to assess the ability of that player to be 1650* on that scale, where the * is used to indicate that it is an estimate rather than a formal Grade. Estimating Grades in multiples of 100 (like 1400*, 1300*, 1200*, …) is easier in principle than estimating handicaps (like 9, 10, 11, …) because the Grade interval of 100 always corresponds to the same winning probability (about 61% i.e. typically winning 3 games out of 5) while the handicap increments 9,10,11,… typically correspond to smaller (level play) winning probabilities which become progressively smaller and are unknown.
For the above reasons, Canada does not have a handicap system (for Association Croquet) and never feels the need for one. (For American Croquet it uses the USCA “Handicap” system, which is effectively a ranking system in all but terminology, virtually never used for bisque determination).
The difficulty of comparing the higher handicaps
The above comparison method is not effective for higher handicaps. As noted above, the slopes of the Best Fitting Curves become too small when the Grades go below 1600. A different approach is clearly needed for higher handicaps. This presents a problem -- I don't know of any existing data that can relate high handicaps from one country to another.
On the Croquet Association website, however, one finds the following description of a test relevant to initial handicapping:
“The handicapper should set the hoops on a court according to the Tournament Regulations. The balls should be placed on court as if the standard opening had been played and the tice missed on the fourth turn. Thus, two partner balls should be placed about three yards apart on the East boundary near hoop 4. One of the other balls should be placed in the tice position near hoop 1 on the West boundary and the final ball should be placed in corner II.This test has several attractive features:“The player whose handicap is being assessed should then construct and play a four-ball break to peg, finishing with a tidy leave. Each attempt should be continued to the peg even if disaster strikes along the way.
“The total number of bisques used to complete this exercise should be noted and the exercise should be repeated about 5 times. The handicapper may disregard the first two attempts if he considers that the player performed poorly due to lack of familiarity with the exercise.”
-- It could be done anywhere in the world, even by isolated players.
-- It provides excellent practice to the high handicapper performing the test (the importance of the result will increase the intensity and make the practice all the more valuable).
-- It measures shooting skills as well as tactical decisions involved in break building and bisque management.
The count so obtained - let us call it the Standard Bisque Count or briefly SB Count - is sometimes used in the UK to determine initial handicaps (via a certain calculation whose details are not relevant here). Towards solving the above problem, I now want to expand that to become a two-way correspondence between Handicaps and SB Counts. Suppose we get 8 or so volunteers in England, all with handicap 7, to perform an SB Count. Then one might conclude that a CA handicap 7 corresponds to the average SB Count of these 8 volunteers. Naturally, more than 8 volunteers would be better. In the same way we could get the SB Count corresponding to CA handicaps 8, 9, and higher. We could similarly establish the SB Counts corresponding to every high handicap of every country with a handicap system.
When all that has been done, the high handicap of one country could be said to correspond to that of another if both handicaps correspond to the same SB Count. While SB Counts lose their usefulness when handicaps become low, that does not matter because we don’t need them for low handicaps.
With this test universally applied, we would also be able to help a (new) country launch an effective handicap system. It would get off to a good start by using the WCF scale, basing initial low handicaps on World Ranking Grades and initial high handicaps on SB Counts. Maintenance of the system, automatic or otherwise, is another matter and what is best for one country need not be best for another.
The success of this project will be heavily dependent on grass roots support.
Worldwide Standard Bisque Counts are needed
I take this opportunity to appeal to players from all countries that have a handicap system to individually perform a STANDARD BISQUE COUNT and report the results to me – specifically, those players with a known handicap and with ability corresponding to a World Ranking Grade below 1600. (See the World Rankings to help establish whether you are in that range.)
I would like at least 5 trials to be reported. Each trial will involve taking the ball through all 12 hoops on a full size court. The trials should preferably be spread over a few days. Kindly include in your report the following information:
(1) the number of bisques used in each trial:
Trial 1: ..... Trial 2: ..... Trial 3: ..... Trial 4: ..... Trial 5: .....
(2) your country: ..................................................
(3) your current handicap: .............
(4) how long your handicap has remained at its current level: ..................
(5) comments (on any relevant aspect, e.g. whether the court used had a bearing on the outcome):
Please email your report to acna@magma.ca using the Subject Title: “SB COUNT REPORT” or mail it to the following postal address: Louis Nel, 8939 Pana Road, Edwards ON, Canada K0A 1V0.
Your support will be of worldwide benefit to croquet and will be warmly appreciated.
A note on the author:
Louis Nel retired in 1999 as Professor of Mathematics at Carleton University in Ottawa. Since then, his enthusiasm for croquet has kept him busy on many fronts. He typically plays about 90 tournaments games per year, mostly Association Croquet, builds his own mallets (forever testing some new idea), runs a website (Association Croquet North America), and is President of Croquet Ottawa (the club he founded in 1994). Since becoming president of Croquet Canada in January 2003, he is even more glued to his computer than before.

Photo by Laura Nel.